ACPE Accreditation
Xavier University of Louisiana College of Pharmacy has fulfilled the accreditation requirements set forth by the Accreditation Council for Pharmacy Education (ACPE) for the Professional Degree Program in Pharmacy and is hereby granted accreditation status through June 30, 2031.
Complaints to the Accreditation Council for Pharmacy Education
The Accreditation Council for Pharmacy Education (ACPE) has an obligation to assure itself that any institution, which seeks or holds a pre-accreditation or accreditation status for its professional program(s) conducts its affairs with honesty and frankness. Complaints from other institutions, students, faculty, or the public against a college or school of pharmacy, including tuition and fee policies, and as related to ACPE standards, policies or procedures, shall be placed in writing in detail by the complainant and submitted to the ACPE office. The complaint shall be submitted to the institution for response. Requests for confidentiality shall be respected to the extent any such information is not necessary for the resolution of the complaint. Details for submission of a complaint to ACPE with regard to accreditation standards can be obtained at the URL https://www.acpe-accredit.org/complaints
North American Pharmacist Licensure Examination (NAPLEX) First-time Pass Rates
The North American Pharmacist Licensure Examination’s (NAPLEX) threshold of acceptability changes annually and is based on the overall first-time pass rate for Xavier graduates being within two standard deviations of the national average. This benchmark is used by the Accreditation Council for Pharmacy Education, the accrediting body of the Pharmacy program. This Table provides data since 2012 of first-time pass rates of the NAPLEX and indicates that Xavier has successfully reached this benchmark each year.
The data reported below includes candidates graduating and taking the exam within the indicated year. Additional NAPLEX pass rate data can be found at https://nabp.pharmacy/wp-content/uploads/NAPLEX-Pass-Rates.pdf.
| Year | # First-Time Takers | Pass Rate |
| 2012 | 126 | 95.0% |
| 2013 | 161 | 86.0% |
| 2014 | 146 | 92.5% |
| 2015 | 146 | 87.7% |
| 2016 | 131 | 77.9% |
| 2017 | 142 | 76.1% |
| 2018 | 152 | 75.0% |
| 2019 | 117 | 82.9% |
| 2020 | 124 | 75.0% |
| 2021 | 125 | 72.0% |
| 2022 | 129 | 58.1% |
| 2023 | 123 | 54.5% |
| 2024 | 87 | 66.7% |
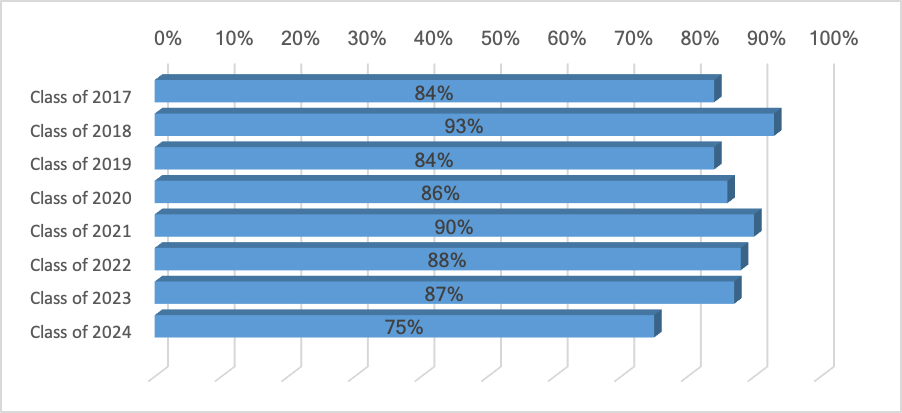
On-time Graduation Rates by Admission Cohort
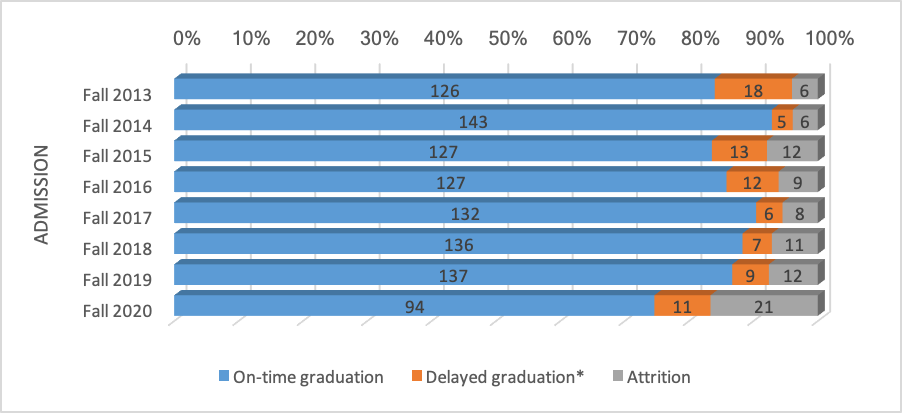
*May include students currently enrolled and on track to graduate.
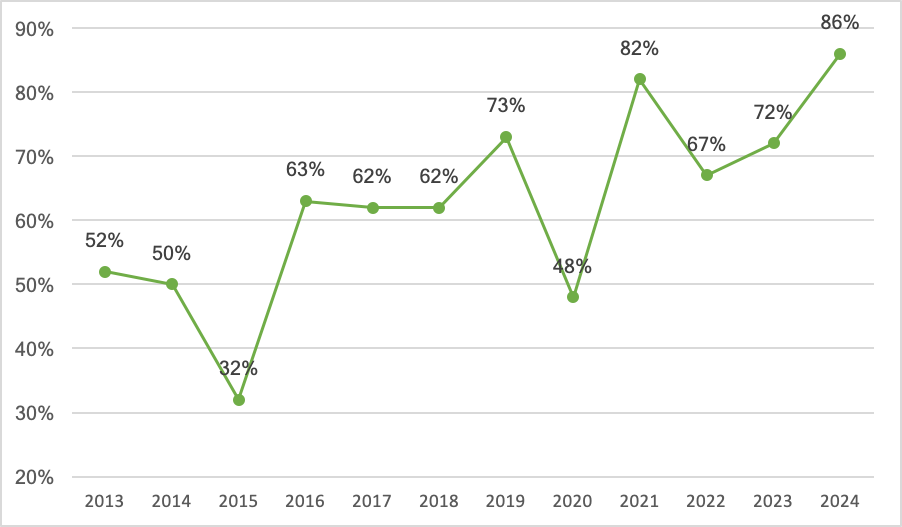
On-time Graduation Rates by Graduation Year
